Educational analysis of the PLTR (Palantir Technologies Inc.) weekly chart
Disclaimer
This analysis is for educational and informational purposes only and does not constitute financial advice. Always conduct your own research before making any investment decisions.
1. Trend Analysis
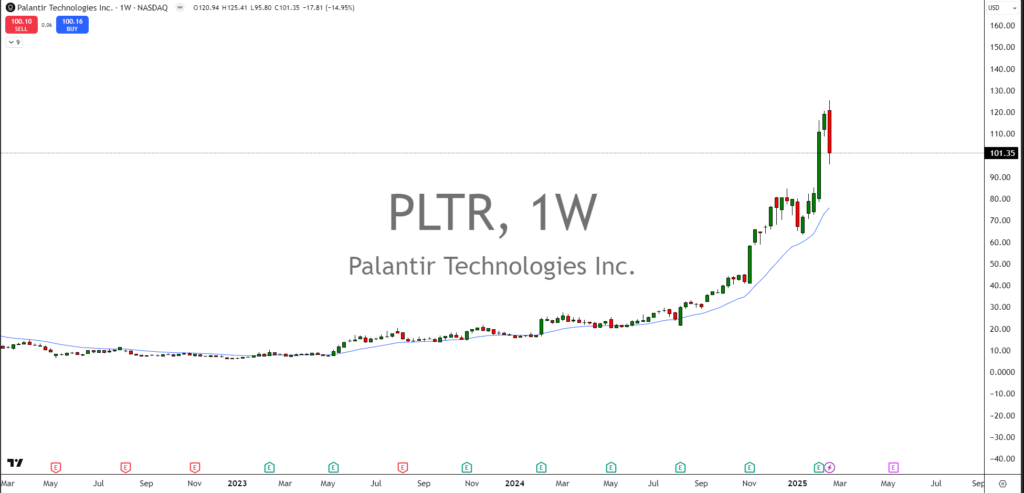
- The stock has been in a strong bullish uptrend since mid-2023, with a significant surge in price action.
- The trend remained sideways to slightly bullish in early 2023, followed by explosive upward momentum starting around Q3 2023.
- The latest price movement shows a sharp pullback after reaching a high near $125, indicating some profit-taking or potential trend reversal signals.
2. Key Support & Resistance Levels
- Resistance: The stock recently hit a high of $125, making it a key resistance level where sellers stepped in.
- Support Levels:
- $90 – This is a key level where price previously consolidated and may act as support.
- $70-75 – A stronger support area aligning with previous price action and the upward trendline.
- $50-55 – A major historical level where buyers previously accumulated.
3. Indicators & Patterns
- Moving Average – The blue line represents a moving average (likely the 20-week MA), which has been acting as a dynamic support.
- Price has consistently bounced off this moving average in previous pullbacks.
- The latest red candle suggests a test of this level.
- Candlestick Formation – The current weekly candle shows a large red bar, indicating strong selling pressure after a steep rally.
- If the next weekly candle closes green, it may signal a bullish recovery.
- If it closes below $90, further downside correction is possible.
4. Market Sentiment & Behavior
- Momentum Shift – The recent sharp sell-off suggests that short-term traders and institutions may be taking profits after a massive run-up.
- Bullish Sentiment Still Intact?
- If price holds above key support levels ($90 or $70-75), long-term bullish sentiment remains strong.
- However, breaking below these levels could indicate a deeper correction.
5. Potential Scenarios (Educational Purpose Only)
Bullish Scenario (Recovery)
- If price finds support above $90, we could see a bounce back towards $110-120.
- A break above $125 could lead to a fresh rally towards $140+ in the long term.
Bearish Scenario (Deeper Pullback)
- If price breaks below $90, the next support at $70-75 could be tested.
- A break below $70 might lead to a longer-term consolidation or correction phase.
6. Key Takeaways
- Trend: Strong bullish trend, but recent pullback indicates caution.
- Support Levels: $90, $70-75, and $50-55.
- Resistance: $125 (recent high).
- Indicators: Moving averages supporting the trend; bearish candlestick signals caution.
- Sentiment: Short-term profit-taking but long-term bullish outlook if support holds.