Educational Analysis of NVDA Weekly Chart (NVIDIA Corporation)
Disclaimer:
This analysis is for educational and informational purposes only and does not constitute financial advice. Always conduct your own research before making any investment decisions.
Last updated: 02/18/2025
Trend Analysis:
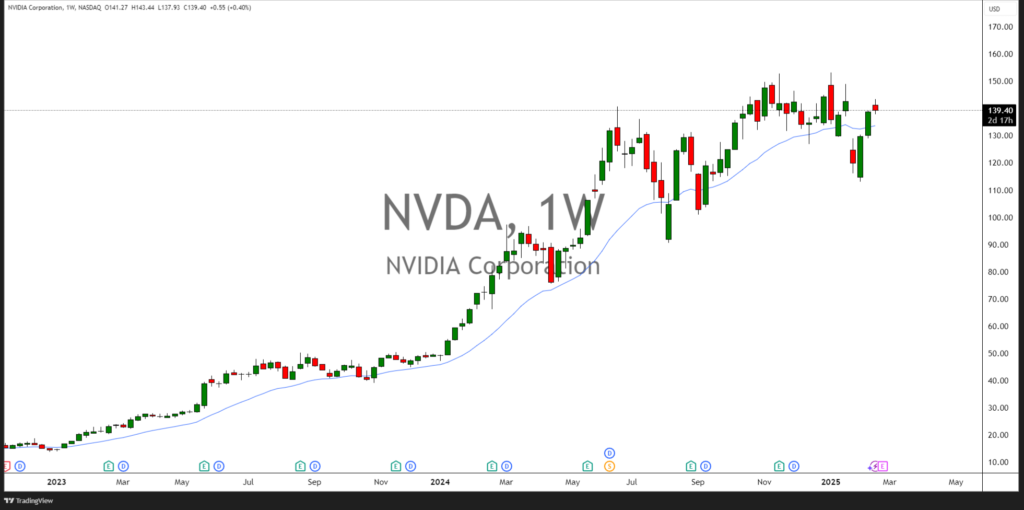
- The chart represents NVDA’s weekly timeframe, showing long-term price movement.
- The overall trend from early 2023 to mid-2024 has been strongly bullish, with consistent higher highs and higher lows.
- However, in the later months of 2024 and early 2025, price action has shown sideways movement, indicating consolidation after a strong uptrend.
Key Support and Resistance Levels:
- Support Zones:
- The recent pullback bottomed around $110–$115, suggesting a strong support area where buyers stepped in.
- Another historical support zone exists around $90–$100, previously a resistance zone before breaking out.
- Resistance Zones:
- $150–$160 has acted as a resistance level where multiple rejections have occurred.
- If the price can sustain above this level, it could indicate a potential continuation of the uptrend.
Moving Average Indicator (Blue Line):
- A moving average (20-week EMA) is plotted on the chart, acting as a dynamic support during uptrends.
- NVDA recently bounced off this moving average, indicating that buyers may still be active.
Candlestick Patterns & Market Sentiment:
- A recent strong green weekly candle closing above the moving average suggests renewed buying interest.
- Previous bearish engulfing patterns (e.g., around September 2024) indicated strong selling pressure, leading to a short-term pullback.
- Sideways movement post-September 2024 suggests that traders are waiting for a breakout or breakdown confirmation.
Potential Scenarios (Educational Purpose Only, No Trade Recommendation):
- If NVDA breaks above $150 and holds, it may indicate renewed momentum and possible upside continuation.
- If it rejects the $150 resistance again and drops below $130, it could signal weakness and further downside potential toward $110–$115.
- Watching for a clear breakout from this range can help understand whether the market is accumulating or distributing.
Key Takeaways (For Learning Purposes):
- Trend Confirmation:
- Strong long-term uptrend, but currently in consolidation.
- Moving average acting as dynamic support.
- Support & Resistance Understanding:
- $110–$115 is a critical support level.
- $150–$160 is acting as resistance.
- Candlestick Patterns:
- Recent bounce with strong green candle may indicate buying interest.
- Previous bearish engulfing patterns led to short-term corrections.
- Market Psychology:
- Traders and institutions may be accumulating at lower levels before a breakout.
- Sideways price action suggests indecision; waiting for a breakout can provide a clearer trend confirmation.